Variation series. average values
Variation series: definition, types, main characteristics. Calculation method
mode, median, arithmetic mean in medical and statistical research
(show with a conditional example).
A variation series is a series of numerical values of the characteristic being studied, differing from each other in magnitude and arranged in a certain sequence (in ascending or descending order). Each numerical value of a series is called a variant (V), and the numbers showing how often a particular variant occurs in a given series are called frequency (p).
The total number of observation cases that make up the variation series is denoted by the letter n. The difference in the meaning of the characteristics being studied is called variation. If a varying characteristic does not have a quantitative measure, the variation is called qualitative, and the distribution series is called attributive (for example, distribution by disease outcome, health status, etc.).
If a varying characteristic has a quantitative expression, such variation is called quantitative, and the distribution series is called variational.
Variation series are divided into discontinuous and continuous - based on the nature of the quantitative characteristic; simple and weighted - based on the frequency of occurrence of the variant.
In a simple variation series, each option occurs only once (p=1), in a weighted series, the same option occurs several times (p>1). Examples of such series will be discussed further in the text. If the quantitative characteristic is continuous, i.e. Between integer quantities there are intermediate fractional quantities; the variation series is called continuous.
For example: 10.0 – 11.9
14.0 – 15.9, etc.
If the quantitative characteristic is discontinuous, i.e. its individual values (variants) differ from each other by an integer and do not have intermediate fractional values; the variation series is called discontinuous or discrete.
Using the heart rate data from the previous example
for 21 students, we will construct a variation series (Table 1).
Table 1
Distribution of medical students by heart rate (bpm)
Thus, to construct a variation series means to systematize and organize the available numerical values (variants), i.e. arrange in a certain sequence (in ascending or descending order) with their corresponding frequencies. In the example under consideration, the options are arranged in ascending order and expressed as integer discontinuous (discrete) numbers, each option occurs several times, i.e. we are dealing with a weighted, discontinuous or discrete variation series.
As a rule, if the number of observations in the statistical population we are studying does not exceed 30, then it is enough to arrange all the values of the characteristic being studied in an ascending variation series, as in Table. 1, or descending order.
At large quantities observations (n>30), the number of occurring variants can be very large, in this case an interval or grouped variation series is compiled, in which, to simplify subsequent processing and clarify the nature of the distribution, the variants are combined into groups.
Typically the number of group options ranges from 8 to 15.
There should be at least 5 of them, because... otherwise it will be too rough, excessive enlargement, which distorts the overall picture of variation and greatly affects the accuracy of average values. When the number of group variants is more than 20-25, the accuracy of calculating average values increases, but the characteristics of the variation of the characteristic are significantly distorted and mathematical processing becomes more complicated.
When compiling a grouped series, it is necessary to take into account
− option groups must be arranged in a certain order (ascending or descending);
− intervals in option groups must be the same;
− the values of the interval boundaries should not coincide, because it will be unclear which groups to classify individual variants into;
− must be taken into account quality features collected material when setting interval limits (for example, when studying the weight of adults, an interval of 3-4 kg is acceptable, and for children in the first months of life it should not exceed 100 g)
Let's construct a grouped (interval) series characterizing data on the pulse rate (beats per minute) of 55 medical students before the exam: 64, 66, 60, 62,
64, 68, 70, 66, 70, 68, 62, 68, 70, 72, 60, 70, 74, 62, 70, 72, 72,
64, 70, 72, 76, 76, 68, 70, 58, 76, 74, 76, 76, 82, 76, 72, 76, 74,
79, 78, 74, 78, 74, 78, 74, 74, 78, 76, 78, 76, 80, 80, 80, 78, 78.
To build a grouped series you need:
1. Determine the size of the interval;
2. Determine the middle, beginning and end of the groups option variation series.
● The size of the interval (i) is determined by the number of supposed groups (r), the number of which is set depending on the number of observations (n) according to a special table
Number of groups depending on the number of observations:
In our case, for 55 students, you can create from 8 to 10 groups.
The value of the interval (i) is determined by the following formula –
i = V max-V min/r
In our example, the value of the interval is 82-58/8= 3.
If the interval value is a fractional number, the result should be rounded to a whole number.
There are several types of averages:
● arithmetic mean,
● geometric mean,
● harmonic mean,
● root mean square,
● average progressive,
● median
IN medical statistics Arithmetic averages are most often used.
The arithmetic mean (M) is a generalizing value that determines what is typical for the entire population. The main methods for calculating M are: the arithmetic mean method and the method of moments (conditional deviations).
The arithmetic mean method is used to calculate the simple arithmetic mean and the weighted arithmetic mean. The choice of method for calculating the arithmetic mean depends on the type of variation series. In the case of a simple variation series, in which each option occurs only once, the arithmetic mean simple is determined by the formula:
where: M – arithmetic mean value;
V – value of the varying characteristic (variants);
Σ – indicates the action – summation;
n – total number of observations.
An example of calculating the simple arithmetic average. Respiratory rate (number of breathing movements per minute) in 9 men aged 35 years: 20, 22, 19, 15, 16, 21, 17, 23, 18.
To determine the average level of respiratory rate in men aged 35 years, it is necessary:
1. Construct a variation series, arranging all options in ascending or descending order. We have obtained a simple variation series, because option values occur only once.
M = ∑V/n = 171/9 = 19 breaths per minute
Conclusion. The respiratory rate in men aged 35 years is on average 19 respiratory movements per minute.
If individual values of a variant are repeated, there is no need to write down each variant in a line; it is enough to list the occurring sizes of the variant (V) and next to it indicate the number of their repetitions (p). Such a variation series, in which the options are, as it were, weighed by the number of frequencies corresponding to them, is called a weighted variation series, and the calculated average value is the weighted arithmetic mean.
The weighted arithmetic mean is determined by the formula: M= ∑Vp/n
where n is the number of observations equal to the sum of frequencies – Σр.
An example of calculating the arithmetic weighted average.
The duration of disability (in days) in 35 patients with acute respiratory diseases (ARI) treated by a local doctor during the first quarter of the current year was: 6, 7, 5, 3, 9, 8, 7, 5, 6, 4, 9, 8, 7, 6, 6, 9, 6, 5, 10, 8, 7, 11, 13, 5, 6, 7, 12, 4, 3, 5, 2, 5, 6, 6, 7 days .
The method for determining the average duration of disability in patients with acute respiratory infections is as follows:
1. Let's construct a weighted variation series, because Individual values of the option are repeated several times. To do this, you can arrange all options in ascending or descending order with their corresponding frequencies.
In our case, the options are arranged in ascending order
2. Calculate the arithmetic weighted average using the formula: M = ∑Vp/n = 233/35 = 6.7 days
Distribution of patients with acute respiratory infections by duration of disability:
| Duration of disability (V) | Number of patients (p) | Vp |
| ∑p = n = 35 | ∑Vp = 233 |
Conclusion. The duration of disability in patients with acute respiratory diseases averaged 6.7 days.
Mode (Mo) is the most common option in the variation series. For the distribution presented in the table, the mode corresponds to an option equal to 10; it occurs more often than others - 6 times.
Distribution of patients by length of stay in a hospital bed (in days)
| V |
| p |
Sometimes it is difficult to determine the exact magnitude of a mode because there may be several “most common” observations in the data being studied.
Median (Me) is a nonparametric indicator that divides the variation series into two equal halves: on both sides of the median is located same number option.
For example, for the distribution shown in the table, the median is 10, because on both sides of this value there are 14 options, i.e. the number 10 occupies a central position in this series and is its median.
Given that the number of observations in this example is even (n=34), the median can be determined as follows:
Me = 2+3+4+5+6+5+4+3+2/2 = 34/2 = 17
This means that the middle of the series falls on the seventeenth option, which corresponds to a median equal to 10. For the distribution presented in the table, the arithmetic mean is equal to:
M = ∑Vp/n = 334/34 = 10.1
So, for 34 observations from table. 8, we got: Mo=10, Me=10, arithmetic mean (M) is 10.1. In our example, all three indicators turned out to be equal or close to each other, although they are completely different.
The arithmetic mean is the resultant sum of all influences; all options without exception, including extreme ones, often atypical for a given phenomenon or population, take part in its formation.
The mode and median, unlike the arithmetic mean, do not depend on the value of all individual values of the varying characteristic (the values of the extreme variants and the degree of dispersion of the series). The arithmetic mean characterizes the entire mass of observations, the mode and median characterize the bulk
Statistical distribution series– this is an ordered distribution of population units into groups according to a certain varying characteristic.Depending on the characteristic underlying the formation of the distribution series, there are attributive and variational distribution series.
The presence of a common characteristic is the basis for the formation of a statistical population, which represents the results of a description or measurement common features research objects.
The subject of study in statistics is changing (varying) characteristics or statistical characteristics.
Types of statistical characteristics.
Distribution series are called attributive built according to quality criteria. Attributive– this is a sign that has a name (for example, profession: seamstress, teacher, etc.).
The distribution series is usually presented in the form of tables. In table 2.8 shows the attribute distribution series.
Table 2.8 - Distribution of types of legal assistance provided by lawyers to citizens of one of the regions of the Russian Federation.
Variation series are distribution series, built on a quantitative basis. Any variation series consists of two elements: options and frequencies.
Variants are considered to be the individual values of a characteristic that it takes in a variation series.
Frequencies are the numbers of individual variants or each group of a variation series, i.e. These are numbers showing how often certain options occur in a distribution series. The sum of all frequencies determines the size of the entire population, its volume.
Frequencies are frequencies expressed as fractions of a unit or as a percentage of the total. Accordingly, the sum of the frequencies is equal to 1 or 100%. The variation series allows one to estimate the form of the distribution law based on actual data.
Depending on the nature of the variation of the trait, there are discrete and interval variation series.
An example of a discrete variation series is given in table. 2.9.
Table 2.9 - Distribution of families by the number of occupied rooms in individual apartments in 1989 in the Russian Federation.
Variation series
A certain quantitative characteristic is studied in the general population. A sample of volume is randomly extracted from it n, that is, the number of sample elements is equal to n. At the first stage of statistical processing, ranging samples, i.e. number ordering x 1 , x 2 , …, x n Ascending. Each observed value x i called option. Frequency m i is the number of observations of the value x i in the sample. Relative frequency (frequency) w i is the frequency ratio m i to sample size n: .When studying variation series, the concepts of accumulated frequency and accumulated frequency are also used. Let x some number. Then the number of options , whose values are less x, is called the accumulated frequency: for x i
A characteristic is called discretely variable if its individual values (variants) differ from each other by a certain finite value (usually an integer). The variation series of such a characteristic is called a discrete variation series.
Table 1. General view of a discrete variation frequency series
| Characteristic values | x i | x 1 | x 2 | … | x n |
| Frequencies | m i | m 1 | m 2 | … | m n |
A characteristic is called continuously varying if its values differ from each other by an arbitrarily small amount, i.e. a sign can take any value in a certain interval. A continuous variation series for such a characteristic is called interval.
Table 2. General view of the interval variation series of frequencies
Table 3. Graphic images of the variation series
| Row | Polygon or histogram | Empirical distribution function | |
| Discrete |  |  | 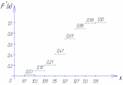 |
| Interval |  | 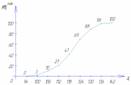 | 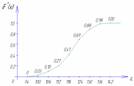 |
For graphical representation of variation series, the most commonly used are polygon, histogram, cumulative curve and empirical distribution function.
In table 2.3 (Grouping of the Russian population by average per capita income in April 1994) is presented interval variation series.
It is convenient to analyze distribution series using a graphical image, which allows one to judge the shape of the distribution. A visual representation of the nature of changes in the frequencies of the variation series is given by polygon and histogram.
The polygon is used when depicting discrete variation series.
Let us, for example, graphically depict the distribution of housing stock by type of apartment (Table 2.10).
Table 2.10 - Distribution of the housing stock of the urban area by type of apartment (conditional figures).

Rice. Housing distribution area
Not only the frequency values, but also the frequencies of the variation series can be plotted on the ordinate axes.
The histogram is used to depict an interval variation series. When constructing a histogram, the values of the intervals are plotted on the abscissa axis, and the frequencies are depicted by rectangles built on the corresponding intervals. The height of the columns in the case of equal intervals should be proportional to the frequencies. A histogram is a graph in which a series is depicted as bars adjacent to each other.
Let us graphically depict the interval distribution series given in table. 2.11.
Table 2.11 - Distribution of families by size of living space per person (conditional figures).
| N p/p | Groups of families by size of living space per person | Number of families with a given size of living space | Cumulative number of families |
| 1 | 3 – 5 | 10 | 10 |
| 2 | 5 – 7 | 20 | 30 |
| 3 | 7 – 9 | 40 | 70 |
| 4 | 9 – 11 | 30 | 100 |
| 5 | 11 – 13 | 15 | 115 |
| TOTAL | 115 | ---- | |

Rice. 2.2. Histogram of the distribution of families by the size of living space per person
Using the data of the accumulated series (Table 2.11), we construct cumulate distribution.

Rice. 2.3. Cumulative distribution of families by size of living space per person
The representation of a variation series in the form of a cumulate is especially effective for variation series whose frequencies are expressed as fractions or percentages of the sum of the series frequencies.
If we change the axes when graphically depicting a variation series in the form of cumulates, then we get ogiva. In Fig. 2.4 shows an ogive constructed on the basis of the data in Table. 2.11.
A histogram can be converted into a distribution polygon by finding the midpoints of the sides of the rectangles and then connecting these points with straight lines. The resulting distribution polygon is shown in Fig. 2.2 with a dotted line.
When constructing a histogram of the distribution of a variation series with unequal intervals, it is not the frequencies that are plotted along the ordinate axis, but the density of the distribution of the characteristic in the corresponding intervals.
The distribution density is the frequency calculated per unit interval width, i.e. how many units in each group are per unit of interval value. An example of calculating the distribution density is presented in table. 2.12.
Table 2.12 - Distribution of enterprises by number of employees (conditional figures)
| N p/p | Groups of enterprises by number of employees, people. | Number of enterprises | Interval size, people. | Distribution density |
| A | 1 | 2 | 3=1/2 | |
| 1 | Up to 20 | 15 | 20 | 0,75 |
| 2 | 20 – 80 | 27 | 60 | 0,25 |
| 3 | 80 – 150 | 35 | 70 | 0,5 |
| 4 | 150 – 300 | 60 | 150 | 0,4 |
| 5 | 300 – 500 | 10 | 200 | 0,05 |
| TOTAL | 147 | ---- | ---- |
Can also be used to graphically represent variation series cumulative curve. Using a cumulate (sum curve), a series of accumulated frequencies is depicted. Cumulative frequencies are determined by sequentially summing frequencies across groups and show how many units in the population have attribute values no greater than the value under consideration.

Rice. 2.4. Ogive of distribution of families by the size of living space per person
When constructing the cumulates of an interval variation series, variants of the series are plotted along the abscissa axis, and accumulated frequencies are plotted along the ordinate axis.
Statistical distribution series are the simplest type of grouping.
Statistical distribution series- this is an ordered quantitative distribution of population units into homogeneous groups according to a varying (attributive or quantitative) characteristic.
Depending on the sign, underlying the formation of groups, a distinction is made between attributive and variational distribution series.
Attributive are called distribution series constructed according to qualitative characteristics, i.e. characteristics that do not have a numerical expression. An example of an attribute distribution series is the distribution of the economically active population of the Russian Federation by gender in 2010 (Table 3.10).
Table 3.10. Distribution of the economically active population of the Russian Federation by gender in 2010
Variational are called distribution series built on a quantitative basis, i.e. a sign that has a numerical expression.
The variational distribution series consists of two elements: options and frequencies.
Options name the individual values of a characteristic that it takes in a variation series.
Frequencies are the numbers of individual variants or each group of the variation series. Frequencies show how often certain values of a characteristic occur in the population being studied. The sum of all frequencies determines the size of the entire population, its volume.
Frequencies are called frequencies expressed in fractions of a unit or as a percentage of the total. Accordingly, the sum of the frequencies is equal to 1, or 100%.
Depending on the nature of the variation of the trait distinguish between discrete and interval variation distribution series.
Discrete variation series distribution - This is a distribution series in which the groups are composed according to a characteristic that changes discontinuously, i.e. through a certain number of units, and accepting only integer values. For example, the distribution of the number of apartments built in the Russian Federation by the number of rooms in them I! 2010 (Table 3.11).
Table 3.11. Distribution of the number of constructed apartments in the Russian Federation by the number of rooms in them in 2010.
Interval variation series distribution - This is a distribution series in which the grouping characteristic that forms the basis of the grouping can take on any values in the interval that differ from each other by an arbitrarily small amount.
The construction of interval variation series is advisable primarily for continuous variation of a characteristic (Table 3.12), as well as if discrete variation of a characteristic manifests itself over a wide range (Table 3.13), i.e. the number of variants of a discrete characteristic is quite large.
Table 3.12. Distribution of subjects of the Southern Federal District of the Russian Federation by area as of January 1, 2011
Table 3.13. Distribution of subjects of the Central Federal District of the Russian Federation by the number of municipal educational institutions as of January 1, 2011.
The rules for constructing distribution series are similar to the rules for constructing groupings.
The analysis of distribution series can be visually carried out on the basis of their graphical representation. For this purpose, a polygon, a histogram, and distributions are built.
Polygon used when depicting discrete variation distribution series. To construct it, in a rectangular coordinate system, the ranked values of the varying characteristic are plotted along the abscissa axis on the same scale, and a scale to express the magnitude of frequencies is plotted along the ordinate axis. Obtained at the intersection of the abscissa axis (X) and the ordinate (Y) axes are connected by straight lines, resulting in a broken line called a frequency polygon.
Histogram used to depict an interval variation series. When constructing a histogram, the values of the intervals are plotted on the abscissa axis, and the frequencies are depicted by rectangles built on the corresponding intervals. The height of the columns should be proportional to the frequencies.
A histogram can be converted into a distribution polygon by connecting the midpoints of the top sides of the rectangles with straight lines.
When constructing a histogram of the distribution of a variation series with unequal intervals, it is not the frequencies that are plotted along the ordinate axis, but the density of the distribution of the characteristic in the corresponding intervals. Distribution density - is the frequency calculated per unit interval width,
those. how many units in each group are per unit of interval value.
A cumulative curve can be used to graphically display variation distribution series. By using cumulates depict a series of accumulated frequencies. Accumulated frequencies are determined by sequential summation of frequencies in groups.
When constructing the cumulates of the interval variation series along the abscissa axis (X) the variants of the series are plotted, and along the ordinate (Y) axis are the accumulated frequencies, which are plotted on the graph field in the form of perpendiculars to the abscissa axis at the upper boundaries of the intervals. Then these perpendiculars are connected and a broken line is obtained, i.e. cumulate.
If, when graphically depicting a variational series of distributions in the form of cumulates of the axis X and U swap places, it turns out ogiva.
Variation series - a series in which are compared (by degree of increase or decrease) options and corresponding frequencies
Options are individual quantitative expressions of a characteristic. Indicated by a Latin letter V . The classical understanding of the term “variant” assumes that each unique value of a characteristic is called a variant, without taking into account the number of repetitions.
For example, in the variation series of systolic blood pressure indicators measured in ten patients:
110, 120, 120, 130, 130, 130, 140, 140, 160, 170;
There are only 6 values available:
110, 120, 130, 140, 160, 170.
Frequency is a number indicating how many times an option is repeated. Denoted by a Latin letter P . The sum of all frequencies (which, of course, is equal to the number of all those studied) is denoted as n.
- In our example, the frequencies will take the following values:
- for option 110 frequency P = 1 (value 110 occurs in one patient),
- for option 120 frequency P = 2 (value 120 occurs in two patients),
- for option 130 frequency P = 3 (value 130 occurs in three patients),
- for option 140 frequency P = 2 (value 140 occurs in two patients),
- for option 160 frequency P = 1 (value 160 occurs in one patient),
- for option 170 frequency P = 1 (value 170 occurs in one patient),
Types of variation series:
- simple- this is a series in which each option occurs only once (all frequencies are equal to 1);
- suspended- a series in which one or more options appear more than once.
The variation series is used to describe large arrays of numbers; it is in this form that the collected data of most medical studies are initially presented. In order to characterize the variation series, special indicators are calculated, including average values, indicators of variability (the so-called dispersion), and indicators of the representativeness of sample data.
Variation series indicators
1) The arithmetic mean is a general indicator characterizing the size of the characteristic being studied. The arithmetic mean is denoted as M , is the most common type of average. The arithmetic mean is calculated as the ratio of the sum of the indicator values of all observation units to the number of all subjects studied. The method for calculating the arithmetic mean differs for a simple and weighted variation series.
Formula for calculation simple arithmetic average:
Formula for calculation weighted arithmetic average:
M = Σ(V * P)/ n
2) Mode is another average value of the variation series, corresponding to the most frequently repeated option. Or, to put it another way, this is the option that corresponds to the highest frequency. Denoted as Mo . The mode is calculated only for weighted series, since in simple series none of the options is repeated and all frequencies are equal to one.
For example, in the variation series of heart rate values:
80, 84, 84, 86, 86, 86, 90, 94;
the mode value is 86, since this option occurs 3 times, therefore its frequency is the highest.
3) Median - the value of the option dividing the variation series in half: on both sides of it there is an equal number of options. The median, like the arithmetic mean and mode, refers to average values. Denoted as Me
4) Standard deviation (synonyms: standard deviation, sigma deviation, sigma) - a measure of the variability of the variation series. It is an integral indicator that combines all cases of deviation from the average. In fact, it answers the question: how far and how often do variants spread from the arithmetic mean. Denoted by a Greek letter σ ("sigma").
If the population size is more than 30 units, the standard deviation is calculated using the following formula:
For small populations - 30 observation units or less - the standard deviation is calculated using a different formula:
Rows built on a quantitative basis, are called variational.
The distribution series consist of options(characteristic values) and frequencies(number of groups). Frequencies expressed as relative values (fractions, percentages) are called frequencies. The sum of all frequencies is called the volume of the distribution series.
By type, the distribution series are divided into discrete(constructed based on discontinuous values of the characteristic) and interval(based on continuous values of the characteristic).
Variation series represents two columns (or rows); one of which provides individual values of a varying characteristic, called variants and denoted by X; and in the other - absolute numbers showing how many times (how often) each option occurs. The indicators in the second column are called frequencies and are conventionally denoted by f. Let us note once again that in the second column relative indicators can be used, characterizing the share of the frequency of individual options in the total sum of frequencies. These relative indicators are called frequencies and are conventionally denoted by ω The sum of all frequencies in this case is equal to one. However, frequencies can also be expressed as percentages, and then the sum of all frequencies gives 100%.
If variants of a variation series are expressed in the form of discrete quantities, then such a variation series is called discrete.
For continuous characteristics, variation series are constructed as interval, that is, the values of the attribute in them are expressed “from... to...”. In this case, the minimum values of the characteristic in such an interval are called the lower limit of the interval, and the maximum - the upper limit.
Interval variation series are also constructed for discrete characteristics that vary over a large range. Interval series can be with equal And unequal at intervals.
Let's consider how the value of equal intervals is determined. Let us introduce the following notation:
i– interval size;
- the maximum value of the characteristic for population units;
– the minimum value of the characteristic for population units;
n – number of allocated groups.
, if n is known.
If the number of groups to be distinguished is difficult to determine in advance, then to calculate the optimal value of the interval with a sufficient population size, the formula proposed by Sturgess in 1926 can be recommended:
n = 1+ 3.322 log N, where N is the number of units in the aggregate.
The size of unequal intervals is determined in each individual case, taking into account the characteristics of the object of study.
Statistical sample distribution call a list of options and their corresponding frequencies (or relative frequencies).
The statistical distribution of the sample can be specified in the form of a table, in the first column of which the options are located, and in the second - the frequencies corresponding to these options ni, or relative frequencies Pi .
Statistical distribution of the sample
Interval series are variation series in which the values of the characteristics underlying their formation are expressed within certain limits (intervals). Frequencies in this case refer not to individual values of the attribute, but to the entire interval.
Interval distribution series are constructed based on continuous quantitative characteristics, as well as on discrete characteristics that vary within significant limits.
An interval series can be represented by the statistical distribution of a sample indicating the intervals and their corresponding frequencies. In this case, the sum of the frequencies of the variants falling within this interval is taken as the frequency of the interval.
When grouping by quantitative continuous characteristics, determining the size of the interval is important.
In addition to the sample mean and sample variance, other characteristics of the variation series are also used.
Fashion The variant that has the highest frequency is called.


