The best indicators for binary options. “Charged” PSAR indicator for Binary options
In the case of binary options, we face a slightly different task. Let's look at the example of a Call/Put option - a trader just needs to guess whether the price will be higher or lower than the current level by the time the expiration date expires. That is, there is no need to make forecasts, determine the levels of setting TP and SL - you just need to guess where the price will be. If you bought a Call option and the price was at least 1 point higher than the current level, then you will still receive the same profit as you would have received if the price were 100 points higher than the option purchase level. The picture is similar with other types of options.
Hence the requirements for indicators:
They should be as simple as possible. The same Ichimoku is unlikely to be useful on binary options, but it works great on the Forex market. It’s just that all its functionality is not needed on BO;
As for which indicators to use—custom ones or from the standard set—a lot depends on what kind of broker you are dealing with. The problem is that not all companies give their clients the opportunity to trade through the MT4 terminal. Many people work through online applications, so installing your own indicator, as you are used to doing with MT4, simply won’t work.
TOP indicators for binary options– a selection for all occasions
As already mentioned, the task when working with BO on the one hand becomes easier (you just need to guess the direction of price movement), but on the other it becomes more complicated - the time factor also comes into play. In addition, we cannot close a deal at any time.
For trading we will use 2 exponential moving averages with periods of 6 and 24, respectively (for trading on H1-m30 charts);
We work according to the following scheme: when the fast EMA crosses the slow one from bottom to top, we buy a Call option, when the opposite intersection occurs, we buy a Put option.
And now the most interesting thing is that if in the case of the Forex market we simply calmly set stop loss and take profit, then in the case of binary options we do not have such an opportunity. Instead, we need to choose the right expiration time.

This is what will depend on final result. It may also be that the direction of the transaction is chosen correctly, i.e. moving averages correctly indicated a change in trend, but at the same time, due to an incorrectly chosen expiration date, at the time of expiration the price ended up in the unprofitable zone, and the trader received a loss. There is nothing you can do about this, the “lottery” element will always remain, but you can increase the likelihood of making a profit:
Choose an expiration period from 1-2 hours when trading on H1-m30;
Pay attention to the behavior of prices and moving averages. If, for example, the price produced a large candle and the crossing of the EMA occurred because of this, then it makes sense to wait - most likely, the next day there will be a small pullback and the entry point will be more promising.

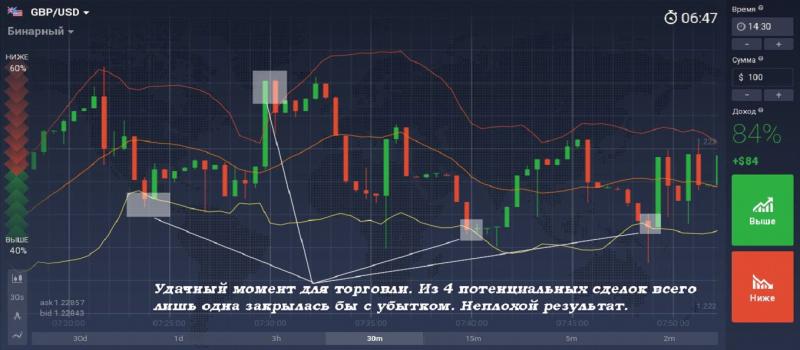
The example shows just such an option - after such a large candle as the first, further growth is possible and in Forex you could simply wait for the price to roll back to the moving averages themselves, buying there. But on BO I prefer not to take risks, so I simply ignore such moments.
The next example is more interesting - the crossing of the EMA did not occur abruptly, but due to a general downward movement over a long period of time in the past. It is clear that it is precisely such situations that have great potential, and we use them in our work.
As for other options for using MA, you can try them too. If you trade on large time intervals, then a heavy MA can be useful in order to determine the general trend and enter at the end of pullbacks. The kickbacks themselves can be searched for in any other way.
If you have a crazy thought that the grail has been found, then drive it away - the signals are actually quite good, but problems can arise during prolonged trends. In this situation, the price does not bounce off the upper/lower border, but simply sticks to it. If you buy an option every time the price touches the BB border, you risk several losses in a row.

We will be interested in situations when the price is not in a hard flat, but at the same time there is no strong trend in the market. At such moments, the channel width is sufficient for trading, and the price consistently and often rebounds from the boundaries of Bollinger Bands.

When trading, you should buy an option at those moments when the price goes beyond the channel formed by the BB lines. But such entries will turn out to be quite risky; there will always be a risk that a trend is starting right now, and the next candle will not return to the BB.
We will be interested in candles with small shadows that close either directly on the channel border or even beyond it, that is, we can say that a breakdown has occurred. The expiration period should not be too long; practice shows that if the price has not returned to the BB within the next 1-2 candles, then it is unlikely that the transaction will be closed with a profit at the expiration date.
If the price touched the channel border, but then returned within the channel, then we skip the signal.
2 popular oscillators and binary options
The trading methods using them are almost identical, so we will not dwell on each separately. So, if you decide to use them in binary options trading, then I would advise:
Do not use indicator lines leaving the oversold/overbought zone as an independent signal. Yes, yes, you heard right - just DO NOT use it, the whole point is that too many false signals are observed with such trading tactics. If you supplement this signal with some other signal, you can easily use it;
Pay attention to extreme indicator values. This applies primarily to RSI. If you zoom out, you will see that RSI sometimes gives strong peaks, reaching values in the range of 90-100. It does not stay at this level for long and literally on the very next candle the price allows it to return to its usual range;


The Commodity Channel Index is a good basis for a trading strategy
The Commodity Channel Index (aka CCI or Commodity Channel Index) can be considered an excellent basis for a complete trading strategy. On the chart, the usual CCI is displayed as a broken line, and levels ±100, ±200 are added in the indicator window.
As for signals, in trading I would advise using:
Intersection of the level indicator line ±100. If the line is level -100 from bottom to top, you can consider buying a call option; you can do the same if the line has crossed the level +100 in the same direction. This suggests that the growing trend is quite strong. Wherein great importance also has the nature of price movement in the interval between the level -100 and +100. If the movement was sluggish and it is clear that the line literally barely reached the +100 level and crossed it, then I would not count on strong further growth. In the case of short positions, the rules are reversed;

You can take a risk and play against the trend. Sometimes there is such a strong movement in the market that the indicator goes beyond the ±300 levels. He usually does not stay in this zone for long, turns around and returns to a more familiar range. It is the CCI rules of construction and the operating principle itself that remains the same. If the signal is strengthened, for example, by the price going beyond the -100 level (as in the example in the screenshot), then this is only a plus. You can, for example, increase the lot size.

IN online platforms There is a Woodie’s CCI indicator for trading, but it would be more logical to call it a ready-made trading system. It uses 2 commodity channel indices and a number of specific rules. You can also trade using it.
An example of an indicator trading strategy for binary options
Indicators themselves are, of course, useful, but trading strategies most often include several indicators. This allows you to filter received signals and enter into transactions with confidence. The ADX indicator needs the -DI line to be above +DI, and not vice versa. According to statistics, the ratio of profitable to losing trades is approximately 2:1. Considering that the profit on the transaction fluctuates in the range of 75-85%, this allows you to stay in the black.
Conclusion: indicators for binary options
Indicators for binary options are the same well-known algorithms; they are simply used by traders for options trading. The operating principles remain absolutely the same; in the end, why should anything change? For analysis, a chart is taken, which for binary options looks exactly the same as when working on Forex.
The algorithms discussed in the article do not claim to be the grail; I will say more - if you use them thoughtlessly, you will get nothing but losses. But they will absolutely be able to help you when drawing up your trading strategy
Binary options trading is carried out mainly on short-term periods. In such conditions, a limited number of analysis tools work; for example, fundamental analysis is definitely out of the question. It is much more practical to use in work without redrawing, in which the value calculated for a specific timeframe remains unchanged.
What is an indicator without redrawing?
To begin with, you need to understand what it is indicators for binary options without redrawing. Under the concept " redrawing» understand the effect of incorrect changes in already calculated indicator indicators. That is, when after some time the chart simply rewrites the old readings.
Such updates are not critical in cases where we're talking about O medium and long term trade. The same cannot be said about working with binary options, which occurs primarily on short time frames. When a signal defines an entry point, changes in readings affect the result most directly.
There are two ways to determine whether there is redrawing on the indicator for binary options.
- This can be a simple visual observation of the chart, carried out on all major timeframes as they lengthen. Usually the effect appears after 25 candles.
- The second option involves searching for a redraw while testing a trading strategy. Tracking is carried out in three options at once: Only Short, Only Long and Long and Short.
There are three conditional groups of indicators in which redrawing does not appear:
- Classic– Bollinger Bands, Alligator, MACD, moving averages.
- Combined. Good results, for example, demonstrate combinations of MACD with RSI or CCI.
- Specialized– Forex x Code, Trend Striker Extreme, WPRSI Signal, ZigZagger, SixSecondTrades, etc. We will talk about them further.
A separate type of such indicators are the so-called “ switches» indicators for binary options. Their peculiarity is the formation of colored indicators on the chart, displaying the likely direction of price movement.
Green or Blue colour traditionally means a hint to buy an UP option, and a red sign encourages you to buy a DOWN option.
Both arrows and regular dots can be used as pointers. The trade should be entered immediately after the candle in which the icon was formed closes.

In the vast majority of cases, arrow indicators are used for trading classic binary options. Such trading is acceptable in the presence of strong price levels.
Difficulties
Arrow indicators for binary options have two problems.
First problem– it’s still the same redrawing. It happens that immediately after opening a trade, the arrows suddenly unexpectedly change direction or disappear. At the same time, we are talking not only about the last one, but also about all previous signals. This means that the indicator is not properly configured with a stabilizing mechanism in case of new quotes. Naturally, such messages are difficult to consider reliable for trading.
A way to avoid this problem only one thing - first make sure that you are using the binary options arrow indicator without redrawing. It is necessary that duringDuring testing, the signal remained unchanged even after noticeable changes began to occur on the price chart. Without this, working with this tool does not make much sense.
Second problem, which can await a trader using a arrow indicator, is associated with the reliability of the signals. Not every one of the many indicators on the market is suitable for binary options. If in ordinary trading certain temporary errors are acceptable, since there is time to adjust in the desired direction (for example, by waiting for a reversal), then there is no such opportunity here. A trader needs the most accurate forecast for a specific candle or candle range.
Advantages of dial indicators
This type of indicators is often called semi-automatic advisors. Their advantages include:
- Ease of use– opening a deal based on the received signal will not be difficult even for a beginner.
- Good results on all time intervals when working with any underlying assets.
- Compatibility with other technical analysis tools.
The best indicators for binary options without redrawing
You can only determine how accurately a particular instrument is signaling by working with it for a sufficient amount of time. Short review several popular indicators without redrawing (download links will be below).
Personally, I do not use indicators in the MT4 trading platform, since the site and its indicators are enough for me. However, if you want to try the MT4 platform, you can.
A very interesting indicator that can be found on the live chart //new.tradingview.com/chart. Click on the indicator button in the menu and enter “ arrows«:

The Binary Option Arrows indicator without redrawing for binary options is based on the signal selection method. As soon as the signal appears, the indicator shows an arrow in the direction in which the trade should be opened.

The indicator can be set to a time interval, for example, one minute. By combining a suitable asset and chart timeframe and indicator settings, you can create an excellent strategy.
You noticed red and green bars on the chart - these are unprofitable and successful trades.
And, as you guessed, the most reliable entries are those after a series of red stripes. This is how it was for me. I opened the indicator on the 1M timeframe and saw EUR/USD three red stripes in a row ( a good sign, it means the next signal will definitely be profitable), I immediately set up the required asset, the period for 60 seconds, the amount of investment in $40 and began to monitor when a signal to buy the option appeared. Here he is:

A signal for the price to fall, which is not surprising after the growing trend. I immediately opened a trade:

An option period of 60 seconds is great time to earn money according to the indicator. I won't bore you, here's what happened:

In 60 seconds we managed to earn 72% of the profit.
This indicator can also be used as an additional tool in conjunction with other indicators, as this can be an excellent combination option different types analysis.
Precise, powerful and best indicator without redrawing for binary options. According to the creators, the indicator is based on unique algorithm, which eliminates noise and produces the most accurate signals for entering a trade.
When testing this indicator over 11 months on different currency pairs, it brought 91% of profitable trades.

Trend Striker Extreme
On the chart of this indicator we see a histogram, each bar of which corresponds to one candle. The blue row indicates a growing trend, the red row indicates a downward trend. You can set the indicator to receive audio alerts to alert you to potential entry points. At the same time, the strength of the alert will be displayed as a percentage.

In the vast majority of cases, these are clear, unambiguous signals, and they occur quite often. The main disadvantage is efficiency - messages come fromsignificant delay. In this regard, the tool should only be used in conjunction with a trend indicator in order to additionally check the accuracy of the signals.
WPRSI Signal
The WPRSI Signal indicator for binary options without redrawing is based on oscillator readings RSI where traditionally a histogram is displayed below the price curve, but WPRSI Signal only displays arrows.

The figure shows an option for “lazy” traders. The indicator has already performed all the calculations for them. There is no histogram here; arrows indicate its invisible presence. Blue signals a buying opportunity UP, red – DOWN.
Six Second Trades
If a trader works on the fastest ones, he should try Six Second Trades. To work, you just need to set the indicator for a one-minute period, and then wait for the signals to form. When a green dot appears, it is acquired UP, red – DOWN. The tool is in demand among traders who prefer to work with currency pairs.

You should enter a trade only after the candle during which the arrow was formed closes. If we are talking about the free version, then you will have to wait for the completion of the next bar. Adjustments are available only in paid versions.
Kill Binary Signals 2
A good free indicator that demonstrates decent results when working with all assets and on any timeframes.

The interpretation of signals here is traditional: blue arrow - UP, red – DOWN. During a flat, the number of false messages increases significantly.
Conclusion
A high-quality binary options indicator without redrawing must meet the following requirements:
- The stability of positive results does not depend on the time frame, type of underlying asset or broker.
- Signals are generated in a timely manner, in sufficient quantity and with a relatively low percentage of erroneous messages.
- The trader is given the opportunity to make adjustments to specific trading conditions (not all free versions this is allowed).
If we talk specifically about arrow indicators, experts recommend not to trust too much the entry points displayed on their chart. In general, all such indicators are often used as a filter, as one of the components of the general toolkit of a binary options trader.
If you find an error, please highlight a piece of text and click Ctrl+Enter, and I will definitely fix it! Thank you so much for your help!
This will be one of the shortest lessons. It's funny, but such a banal topic as indicators is difficult to describe from a psychological point of view. It is because of indicators that beginners have so many problems with trading in the initial stages. I had them too.
A novice trader needs a foothold. This whole price on the charts looks so unpredictable, especially when the first enthusiasm subsides and you realize that it is not bouncing like a ball at all from the support and resistance lines. When he wants, he breaks them, sometimes he teases them and supposedly breaks them (false breakouts), and sometimes he seems to deliberately bounce when you are waiting for a breakout. The head goes all around, the deposit decreases.
The indicator is strict and clear. He has clear rules, he often even shows with arrows where to enter. There’s just one problem with the indicators...
The indicator shows only the past
And it's right there in the title. This is what beginners, and often even experienced traders. They forget how any indicator works. And this:
Mathematical operation with past data.
Do you understand? The indicator cannot “predict” the future. It is based on a very simple formula. Let's say we took 14 candles, the minimum price, the maximum, played around a little, bam - we have stochastics. But what does it show? Past price data. I will save you a lot of time if you immediately understand the simplest trading truth:
The indicator does not predict the future. It only shows the past.
Indicator structures past data, but is not able to look into the future even 1 point. We will do it for him, with our trading brains.
For this reason, trying to trade using indicators alone usually fails. This is not surprising. The child could trade MACD crosses or oscillator lines. Moreover, any programmer who has mastered “C++ in 21 days” can easily write a trading robot that will make such entries automatically.
And they are all tested. All popular indicators of the world. On the TradingView platform you can find ready-made strategies with them that can be run on history with one button and show the results.
And there it turns out that any naked indicator strategy, shamelessly waving its arrows, looks completely indecent, because it, in itself, only loses money in any foreseeable period.
This, by the way, is one of the misconceptions of beginners. They believe that if the indicator gives results for a day or a week, then they have found the “money” button. In fact, they only got a short-term piece of luck from the theory of probability. The more historical period, on which the indicator is tested, the more losses it will ultimately show.
Why are indicators needed?
We have already come a long way:
And indicators can become a useful addition to these topics - to technical/fundamental analysis. They can complement your understanding of the market and will be a good assistant who will come to your aid in difficult times. But this is not a shining knight in armor who will save you if you do not understand what is happening with the market.
The indicator is not capable of this. It carefully organizes old prices and helps you understand what was happening in the market before you made a decision right here and now.
- If you regard indicators and indicator systems as a supplement, they will help.
- If you rely only on them, beware, you are asking too much from a simple formula.
No matter how beautiful the indicator looks, it is only a formal structuring of old data:

Initial indicators for binary options
The most popular indicators are slowly described on the website. I don’t like to read muddy texts written by people suffering from technical brain confusion, so I give the simplest descriptions.
So far the following have been described:
IN public library TradingView contains thousands, many thousands of indicators and indicator systems:

150 indicator systems
I also spent a lot of time collecting and classifying indicator strategies for binary options on the forum. The result is a catalog sorted by timeframe. On the forum you can download them for MetaTrader or use them immediately on your live chart.
The indicators there are very different: arrows, trend indicators, reversal indicators, with redrawing, without redrawing, green and grey-brown-crimson. The choice is luxurious, for every taste.
The best and most accurate indicator for binary options
You have already gone through enough training stages in ours to understand that there is no such miracle. But that's good. Why?
Imagine that some asshole got an indicator that is guaranteed to ensure successful trades. Where would we all be then, together with the brokers? Only thanks to the fact that technical analysis- an inexact, subjective science, the market breathes competition and the patient take the money of the weak. Here, control over emotions, the ability to manage money and risks, rather than specific systems, are much more important. If a citizen or a group of citizens appears here, “vanging” the market unmistakably, the time will come to dry crackers, and for everyone at once.
Luckily, it's fantastic. Always predicting the market accurately is like predicting the future of your country from history. The general vector can be approximately determined, but the exact one cannot. So our government, having dropped the ruble almost 3 times, is doing big eyes and is justified after the fact.
A certain Sechin managed to incorrectly predict the price of oil 7 times in a row. Eh, guys. If the head of Rosneft 7 times in a row cannot predict the price of oil (and he is supposed to, by virtue of his position), what can we expect from some indicator for UKOIL (Brent oil ticker).
What is a reliable indicator for you personally?
This is a good question. Because over time you understand which indicator is really good for you personally. Because you studied it inside and out, in a variety of market conditions. Only after hundreds/thousands of hours of testing can the indicator become “native”.
For me, these were Bollinger Bands and Stochastics. I love the classics. I don't need complex systems. The basis of my work is Dow theory with a significant admixture of fundamental analysis. And these two indicators are help, and then only in some cases. Often there is no need for them at all.
Bollinger for me is a channel volatility indicator. It's such big worm, its sides swell with volatility or contract when the worm is starving and the price moves barely. Volatility as a reflection of the cyclical strength of the market helps when dealing with support and resistance.

Well, I use stochastics exclusively in sideways movement (consolidation). In my experience, this is where the stochastic shows itself the best way, and its overbought and oversold conditions ensure filtering of entries from the p/s. The stochastic has many tricks, described in the articles of its creator, George Lane.
For example, Stochastic RSI is good in the overbought/oversold zone at the 2nd successive top, which is slightly lower than the first, with moderate sideways price movement:

And there are a lot of such tricks. There are “hooks” that it forms under certain conditions, but divergence is generally a powerful tool. This way the indicator will become a whole world that you build into your system.
Only after gaining many hours of experience will you be able to say that yes, this is an excellent “turkey,” as traders jokingly call indicators.
Binary options without indicators
Is it possible to work with binary options, and even Forex, without indicators at all? Undoubtedly. Have you forgotten that the charts are just price movements? This is just a column of numbers, and a graph is their visualization. You can predict price movements using simple lines and graphic figures.
However, many people forget that Japanese candlesticks are also an indicator. Therefore, when we use candlestick combinations, we use, so to speak, a base level indicator.
And of course, I gradually incline everyone on the site to indicator-free trading, be it price action or the foundation in the form of the Dow Theory and support/resistance. My work schedules often look like this:

Non-indicator trading involves extensive use of:
- technical and fundamental analysis;
- candlestick patterns, figures, their combinations and behavioral models;
- moving averages as an alternative to trend lines.
At its core, indicator-free trading helps you understand the essence of markets and teaches you to perceive their movements without numerous crutches.
Choose your indicator
So, let's summarize. There are tens of thousands of indicators, and they all show the past by structuring old data. Therefore, there is no need to sort through hundreds and thousands of them. You just need to choose your favorite indicator, thoroughly study its operation in different market conditions and integrate it into your trading system. This way you will get an excellent working tool.
If you fanatically enter on the arrows of any indicator, forgetting about technical analysis, Dow theory, news and other trading elements, you will be disappointed. So take indicators soberly - as an additional assistant, one of the elements of your trading system, which is patiently created for yourself.
There is no need to rely on the indicator as a magic wand. He does not work and cannot work in this capacity. This is just an assistant, sometimes useful, but often there is no need for it.
- Back:
- Forward:
To make a profit on binary options, unlike Forex, you need to determine the correct direction of the price, no matter how many points the price changes 1 or 100. On binary options, the fixed profit is 65-750%.
In order to correctly predict the direction of an asset and receive a signal to buy an option, many traders for their binary strategy use indicators and Forex trading systems.
For strategies using indicators and trading systems, you need to open a demo account (training) with brokers AForex or InstaForex, or in any other DC. You will find how to download and install the Metetrader4 trading terminal in the video.
To create your own strategy for making money on binary options, you need to choose an indicator to your liking, or better yet several, for more accurate forecast and install it in the MT4 terminal. When the indicator gives a signal, we purchase a “CALL” option to buy an asset, and “PUT” to sell. At the beginning it seems that everything is very simple, but it is not so, you need to learn how to use an indicator or trading system.
The trader himself chooses the type of option and the expiration time of the transaction. It is better to practice on a demo account; many binary options brokers have demo accounts. For example, the popular binary broker Olymp Trade opening a demo account will take just a few seconds and you will immediately receive a set of ready-made strategies.
It is better to trade trading systems and indicators during the Asian and European sessions. During the release of important economic news, do not trade 10 minutes before the release and 10 minutes after.
1. Trading strategy 60 seconds Reader
This trading system is designed specifically for binary options and is considered one of the best. Works with any binary options broker that has the “60 seconds” trade type.
2. CallPut-Options trading system

This trading system is designed specifically for binary options. Sound and visual notification.

Timeframe M15-H1. The expiration period is 15, 30 and 60 minutes according to the time frames. The trade is opened at the end of the formation of the previous candle. The template is universal and can be installed on any currency pairs. Download
4. Trading system Forex-Profit-Binary

5. Trading system ForexMT4SBB

6. Trading system Cloud Ichimoku Breakout
![]()
This forex system is called Ichimoku Cloud Breakout or kumo breakout, courtesy of Lars Larsson from Stockholm.
7. Forex MT4 Carrows trading system

This indicator is designed for small and large cycles. Developed by ForexMT4Systems team.
8. Scalping Profit trading system

The Scalping system can be used for any period, but it is recommended to trade on M5 (5 min.). For trading binary options, the best time frame is M5, the expiration date of the option is 5-15 minutes.
9. Trading system ForexMT4HASignal

The ForexMT4HASignal trading system was provided and developed by MetaTrader4ForexSystems.

Trading system GSOBinaries is designed for binary options trading. Timeframe M5, expiration time 10-30 minutes.
11. Profitable Strategy trading system

The Profitable Strategy trading system is designed for trading binary options. Timeframe M30 or H1, expiration period 30-90 minutes.
12. Trading with the Parabolic SAR indicator (Video)

Indicator Parabolic SAR very popular among traders due to punctual signals for entering a trade. The video will tell you how to use the indicator on the platform and demonstrate real examples works by Paradolic.


